Hedging against stock indices
Correlation coefficients against the Nikkei average
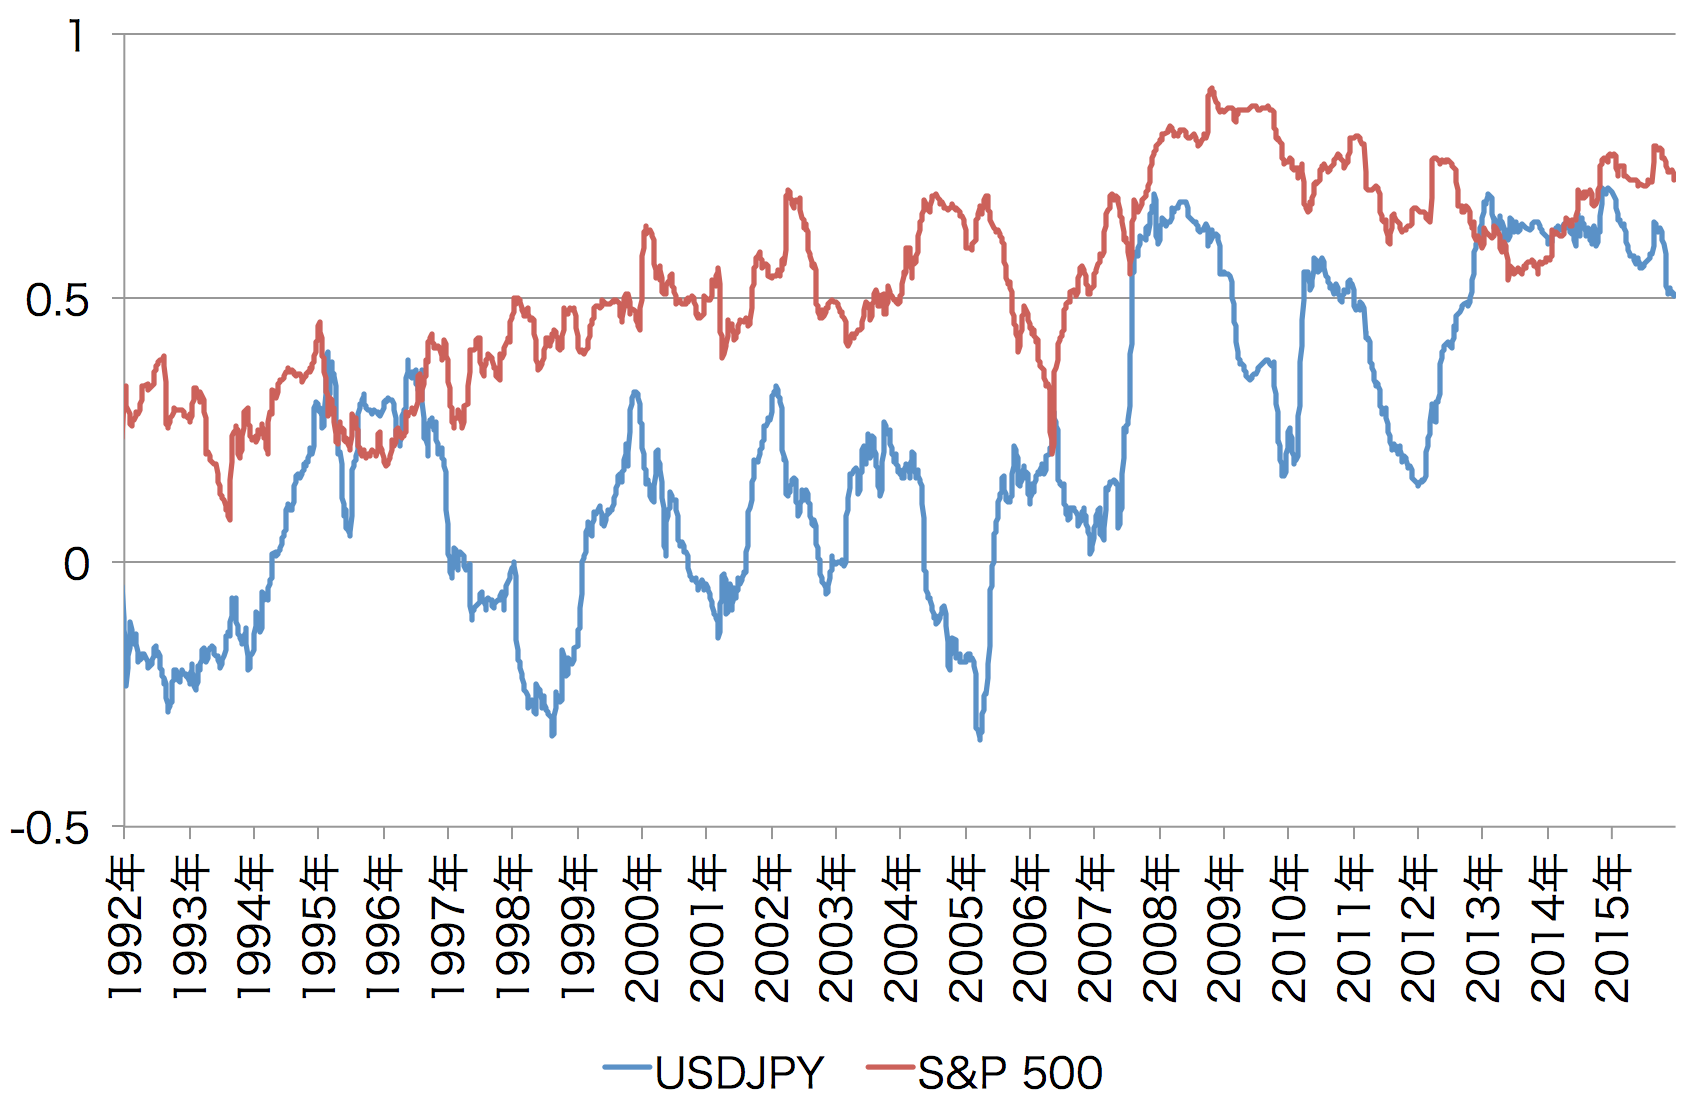
Figure 1: Correlation coefficients against the Nikkei average
(each point is the correlation coefficient of the 3- to 10-day log differences over the past 200 days)
(each point is the correlation coefficient of the 3- to 10-day log differences over the past 200 days)
Slope of the linear regression against the Nikkei average
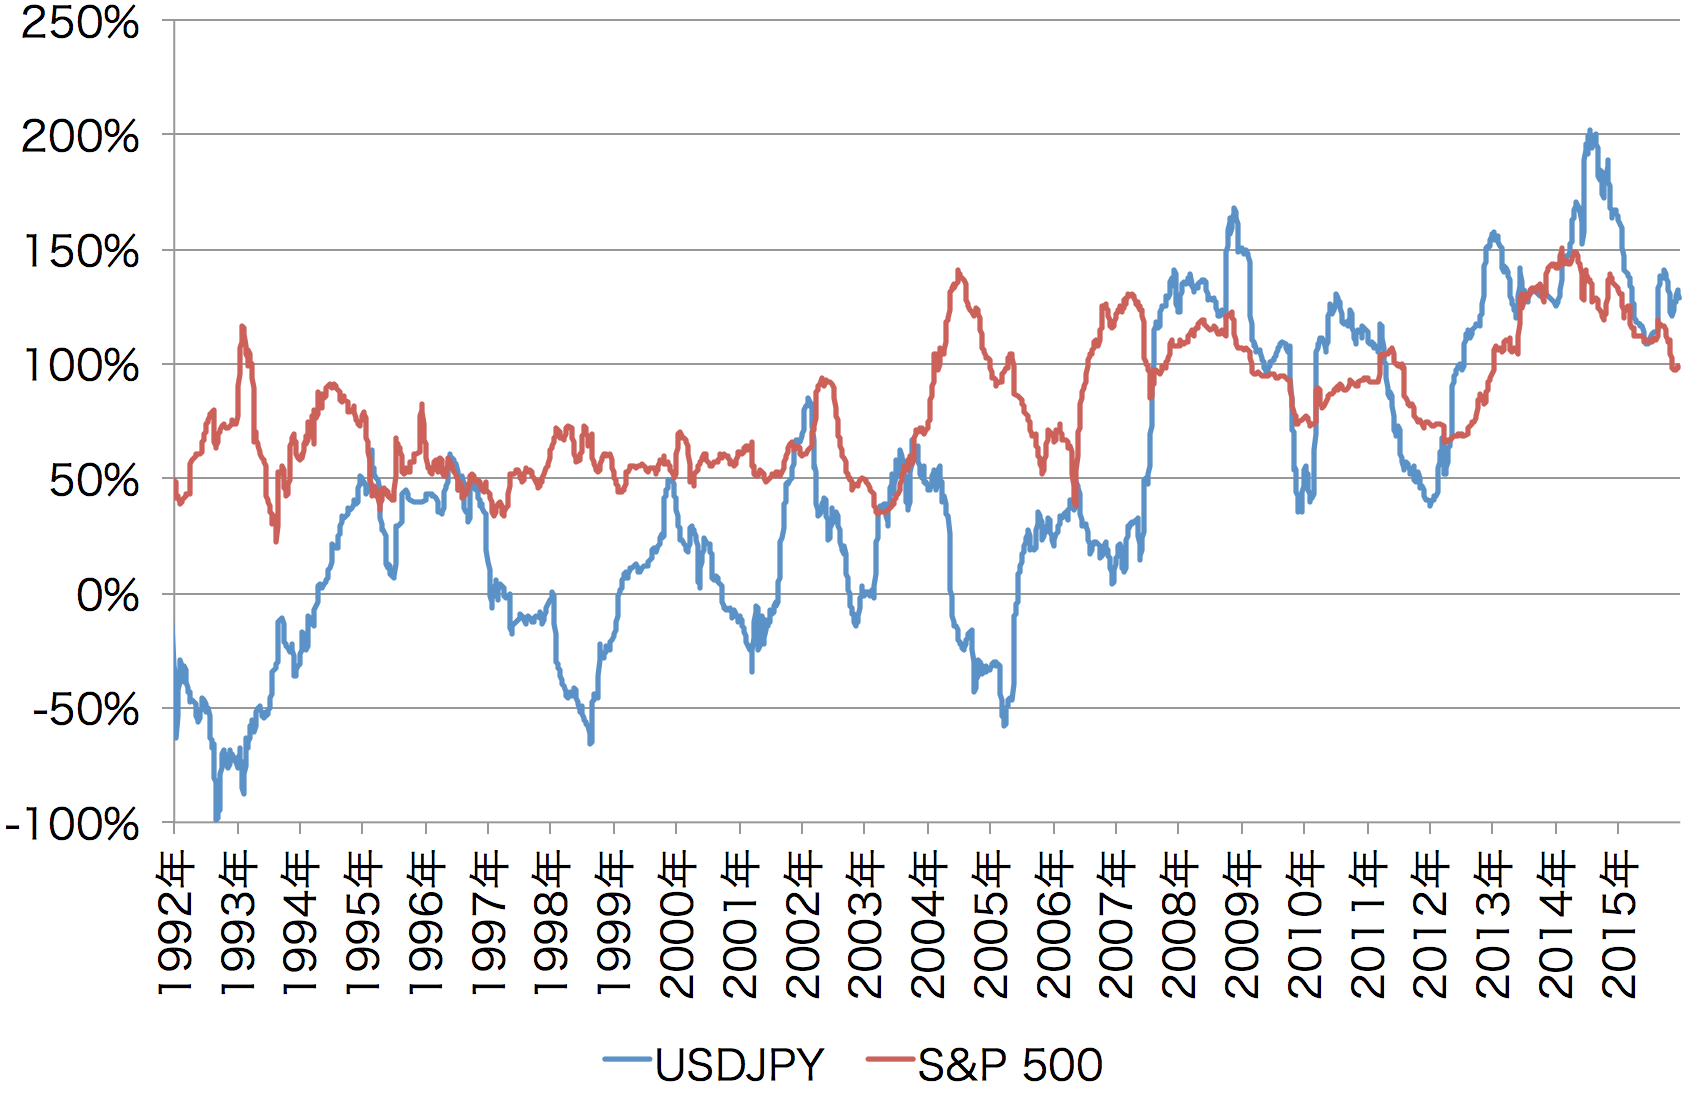
Figure 2: Slope of the linear regression against the Nikkei average
(each point is the correlation coefficient of the 3- to 10-day log differences over the past 200 days)
(each point is the correlation coefficient of the 3- to 10-day log differences over the past 200 days)
Hedge simulation for the Nikkei average
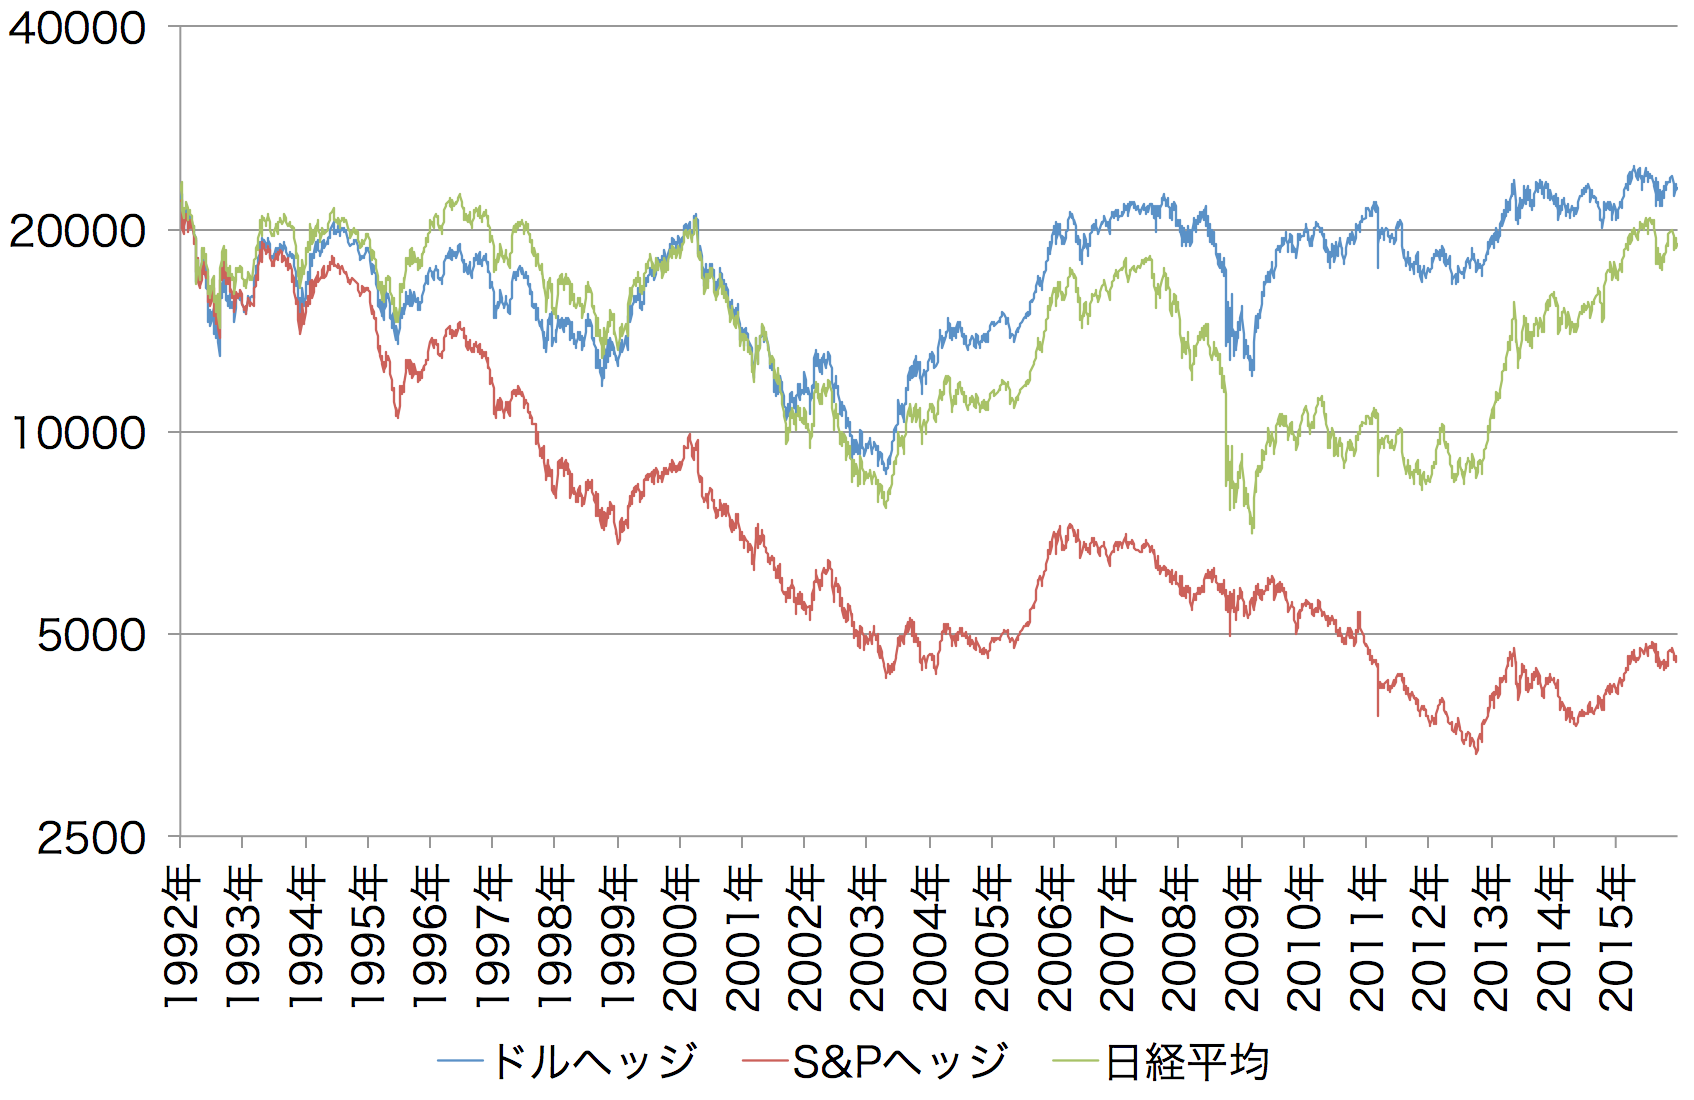
Figure 3: Hedge simulation for the Nikkei average
Hedge simulation for the S&P 500
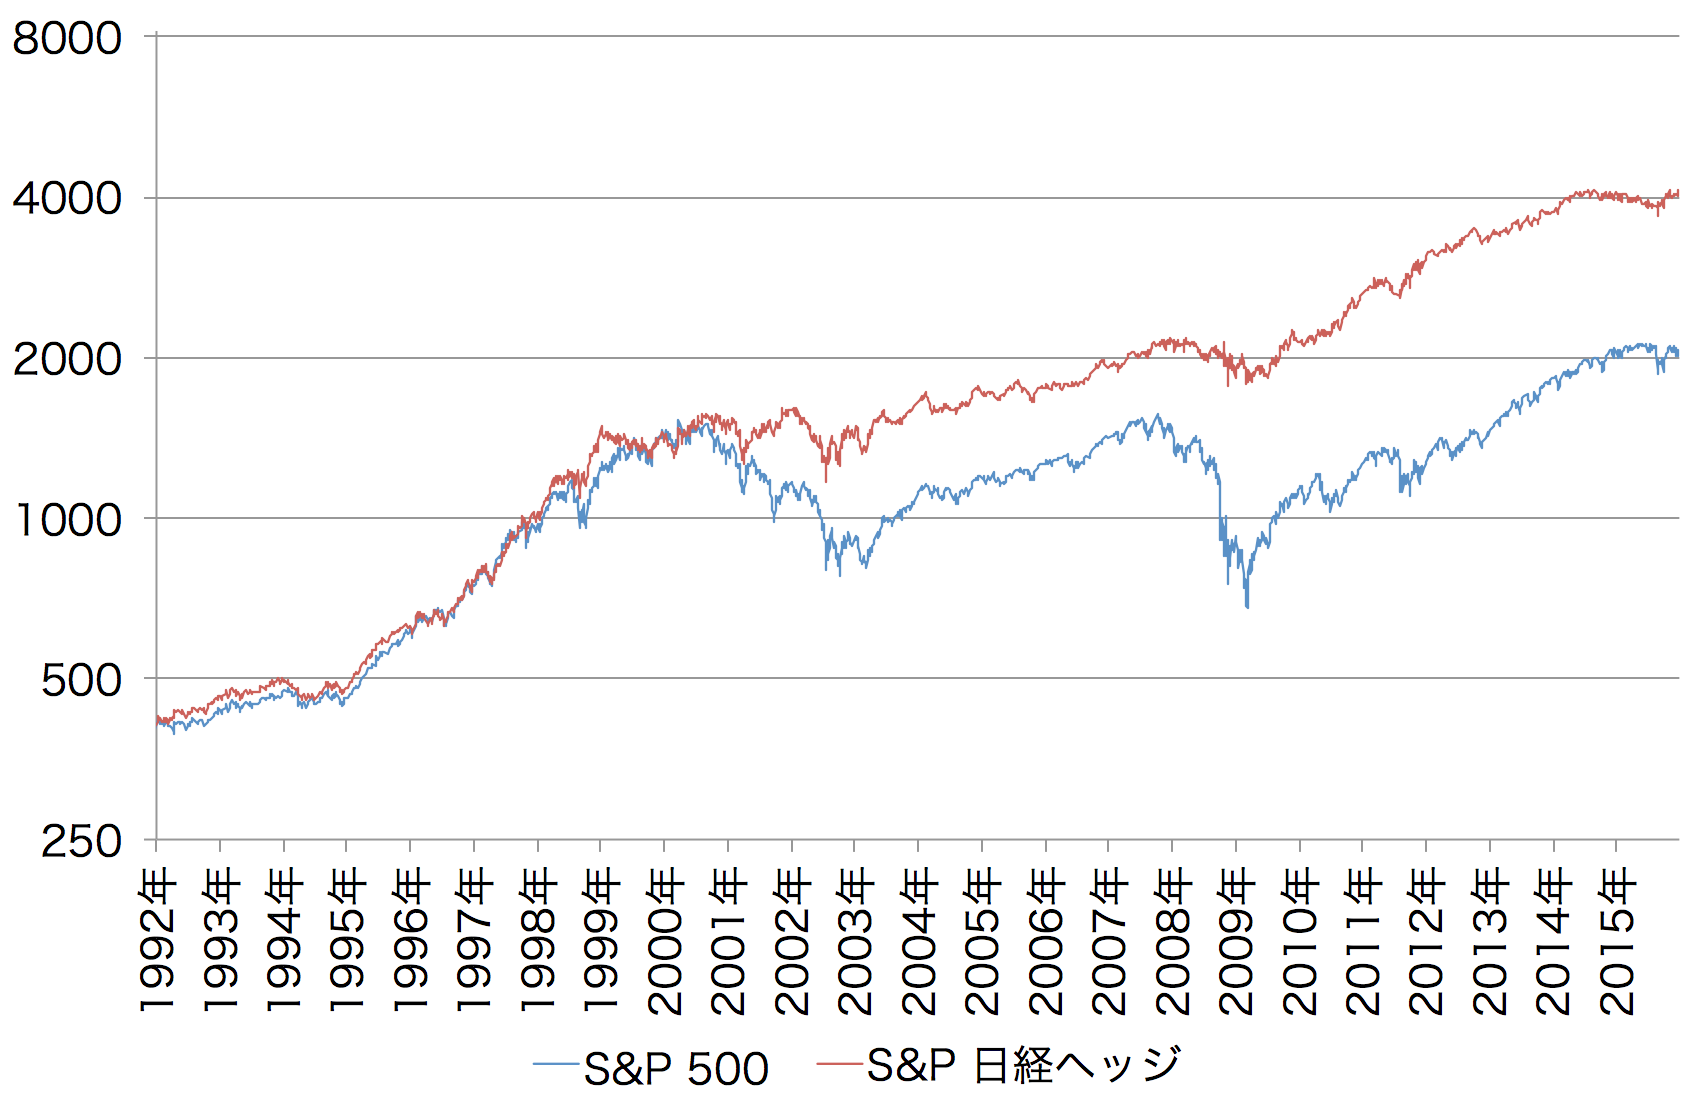
Figure 4: Hedge simulation for the S&P 500
Related information
- Nikkei average correlation calculation … the program used in this article