Long-term investment strategies using ETFs

Published on March 1, 2016

Investment strategies with ETFs

On this page, we consider actual investment with exchange-traded funds using the Nikkei Stock Average from 1970 onward.
An exchange-traded fund (ETF) is an investment trust that makes it possible to invest in line with the Nikkei Stock Average, and it is a product that can be traded at any time with low fees, just like stock trading. Among ETFs there are so-called double-bull and double-bear funds, which apply 2x and -2x leverage to the Nikkei Stock Average, respectively. Being able to apply leverage effectively halves the fees relative to the position size, which is efficient, and furthermore, the existence of negative leverage makes it possible to eliminate periods during which no investment activity is possible.

Fee settings

SBI Securities' fees are 0.15% for trades of 100,000 yen or less, 0.053% for trades of 1,000,000 yen or less, and 0.004% for trades of 30,000,000 yen or less, making it possible to trade at very low fees, but here we carry out the calculations assuming a flat fee of 0.15%.

Basic strategy

From the research results of Long-term investment strategies using the Nikkei Stock Average, we know that a method of comparing the current value with the average over roughly the past 50 to 100 days can stably yield profits. In actual trading, we must allow some margin in the range of fluctuation, otherwise we would make pointless trades, so we set 2% as slack and simulate trading. Specifically, when the price is rising we cancel the sell position, when it is falling we cancel the buy position, when it has risen 2% or more we buy, and when it has fallen -2% or more we sell.
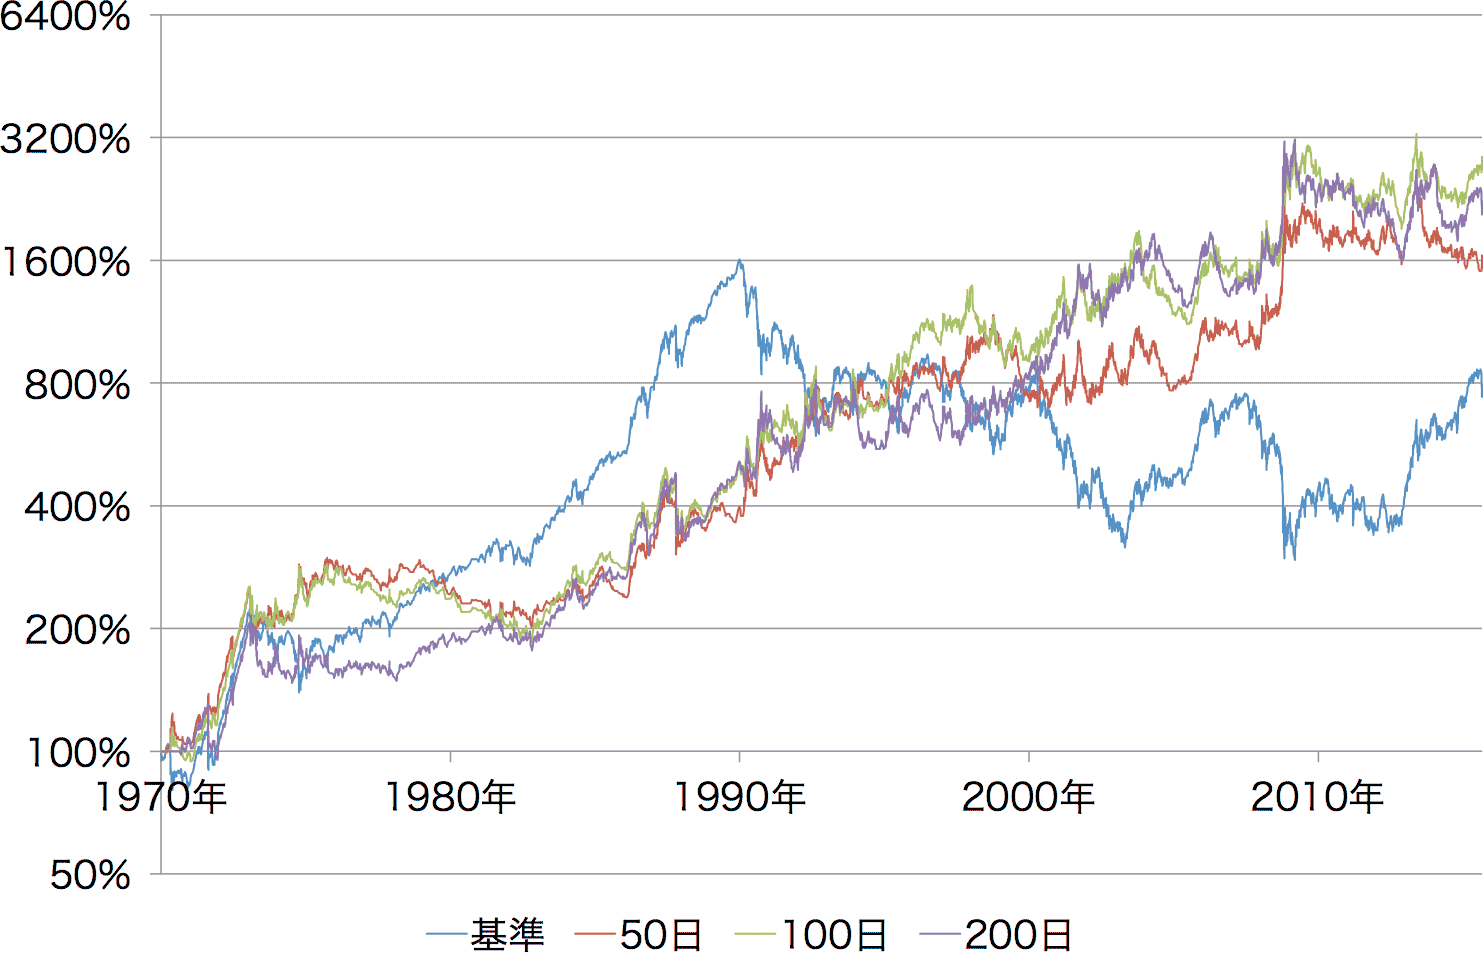
Figure 1: ETF investment simulation
(slack 2%, fee 0.15%, leverage ±1x)
From the simulation results, we can see that using this method yields continuous profits even during the recession from 2000 onward, compared with simply investing in the Nikkei Stock Average. The fact that all approaches struggled in the late 1970s, and that the 50-day approach struggled in the early 2000s, suggests that there may be periods to which each is better or worse suited. Next, therefore, we consider a method of dynamically changing how many days of past average to look at.

Appendix