An Investigation of EC2 Micro Instances
Behavior Under High Load
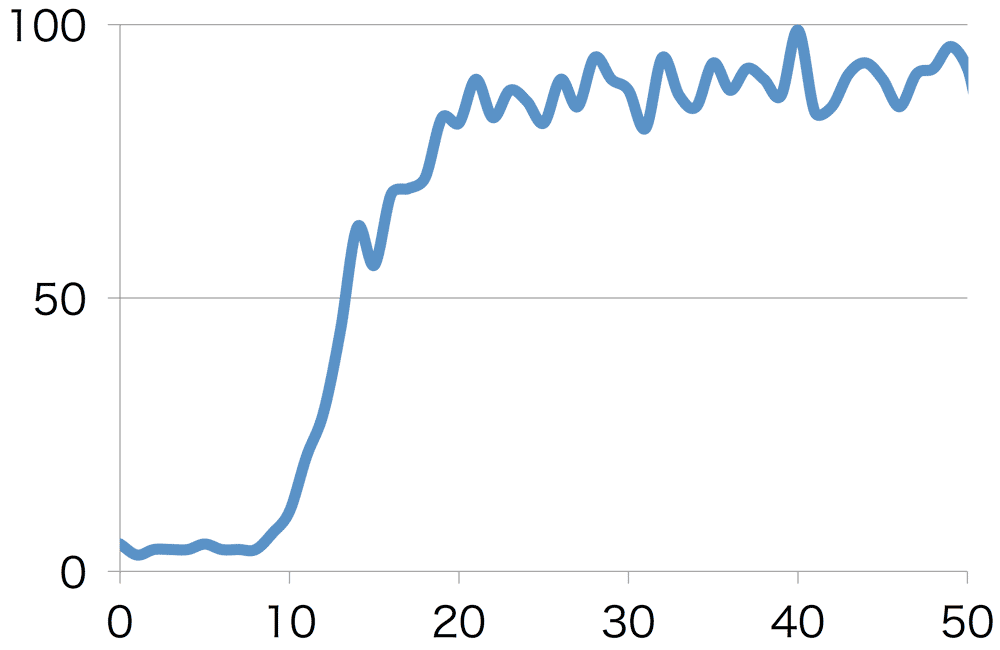
Figure 1: CPU steal rate when a high load is applied
(the vertical axis is the CPU steal rate [%], and the horizontal axis is the time since the high load began [seconds])
(the vertical axis is the CPU steal rate [%], and the horizontal axis is the time since the high load began [seconds])
I applied load to the CPU while monitoring the steal column of /proc/stat once per second. To reliably return to fast mode, each trial was spaced 200 seconds apart. The figure above is the average of 100 trials.
Behavior Over Very Short Intervals in Slow Mode
I investigated the time until the switch to slow mode while watching a for-loop counter and its execution time, and performed the calculation on the trials in which the duration of fast mode was 1 second or less.
Duration of Fast Mode
I investigated the time until the switch to slow mode while watching a for-loop counter and its execution time, and performed the calculation on the trials in which the duration of fast mode was 1 second or more.
Change in Available Runtime Over Time
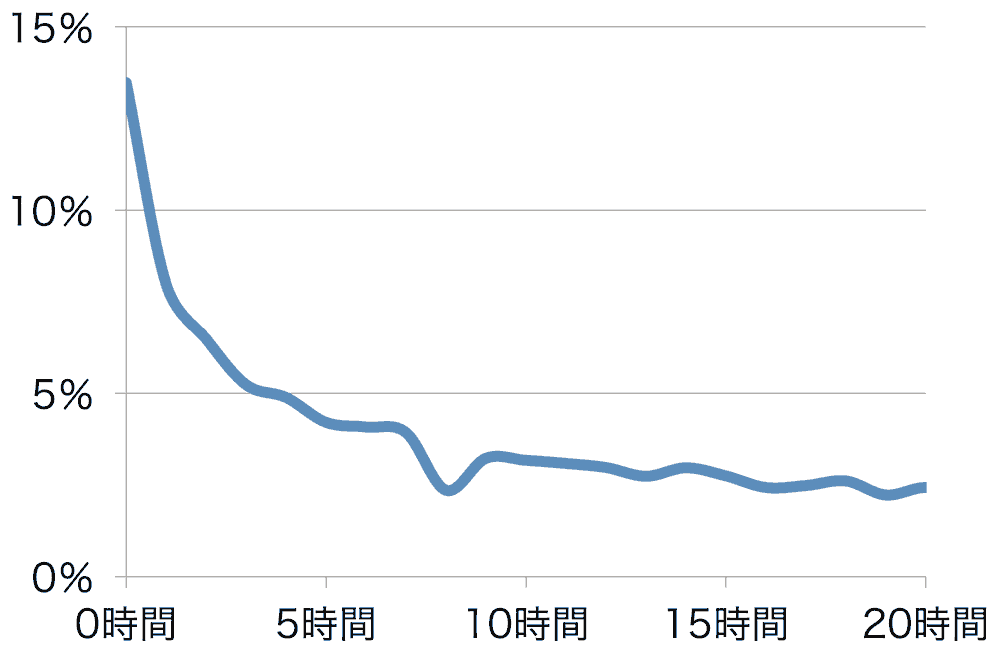
Figure 2: Change in available runtime over time
(the vertical axis is the CPU utilization [%], and the horizontal axis is the duration of the experiment)
(the vertical axis is the CPU utilization [%], and the horizontal axis is the duration of the experiment)
For 5 micro instances immediately after launch, I investigated the change in the number of for-loop iterations completed during each one-hour interval.